
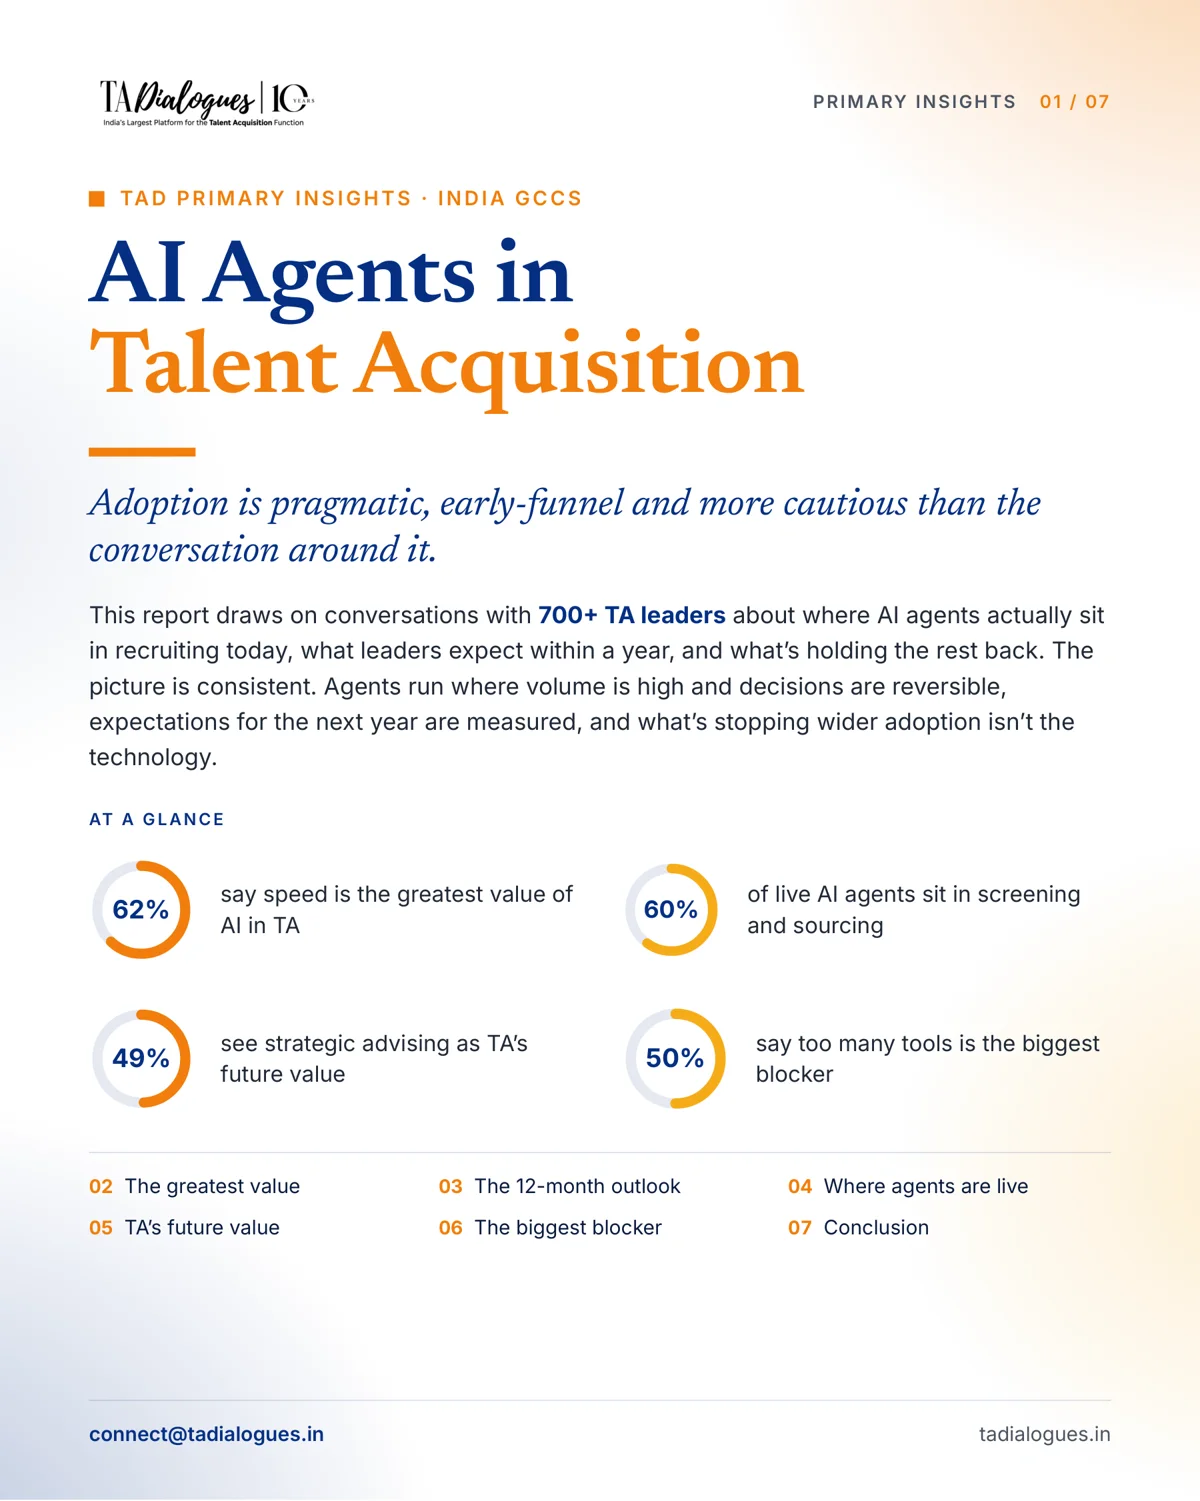
The Data Says Quality Matters. The Systems Say Otherwise.
TA won the argument that quality matters. The measurement never caught up.
Ask TA leaders what matters most and the answer comes fast: quality of hire. Ask whether they can prove it, and things get complicated. This report draws on conversations with 700+ TA leaders about what they measure, what they trust and what the business actually uses. The gap between those three is where the story lives.
8 pages · PDF · Free with your email
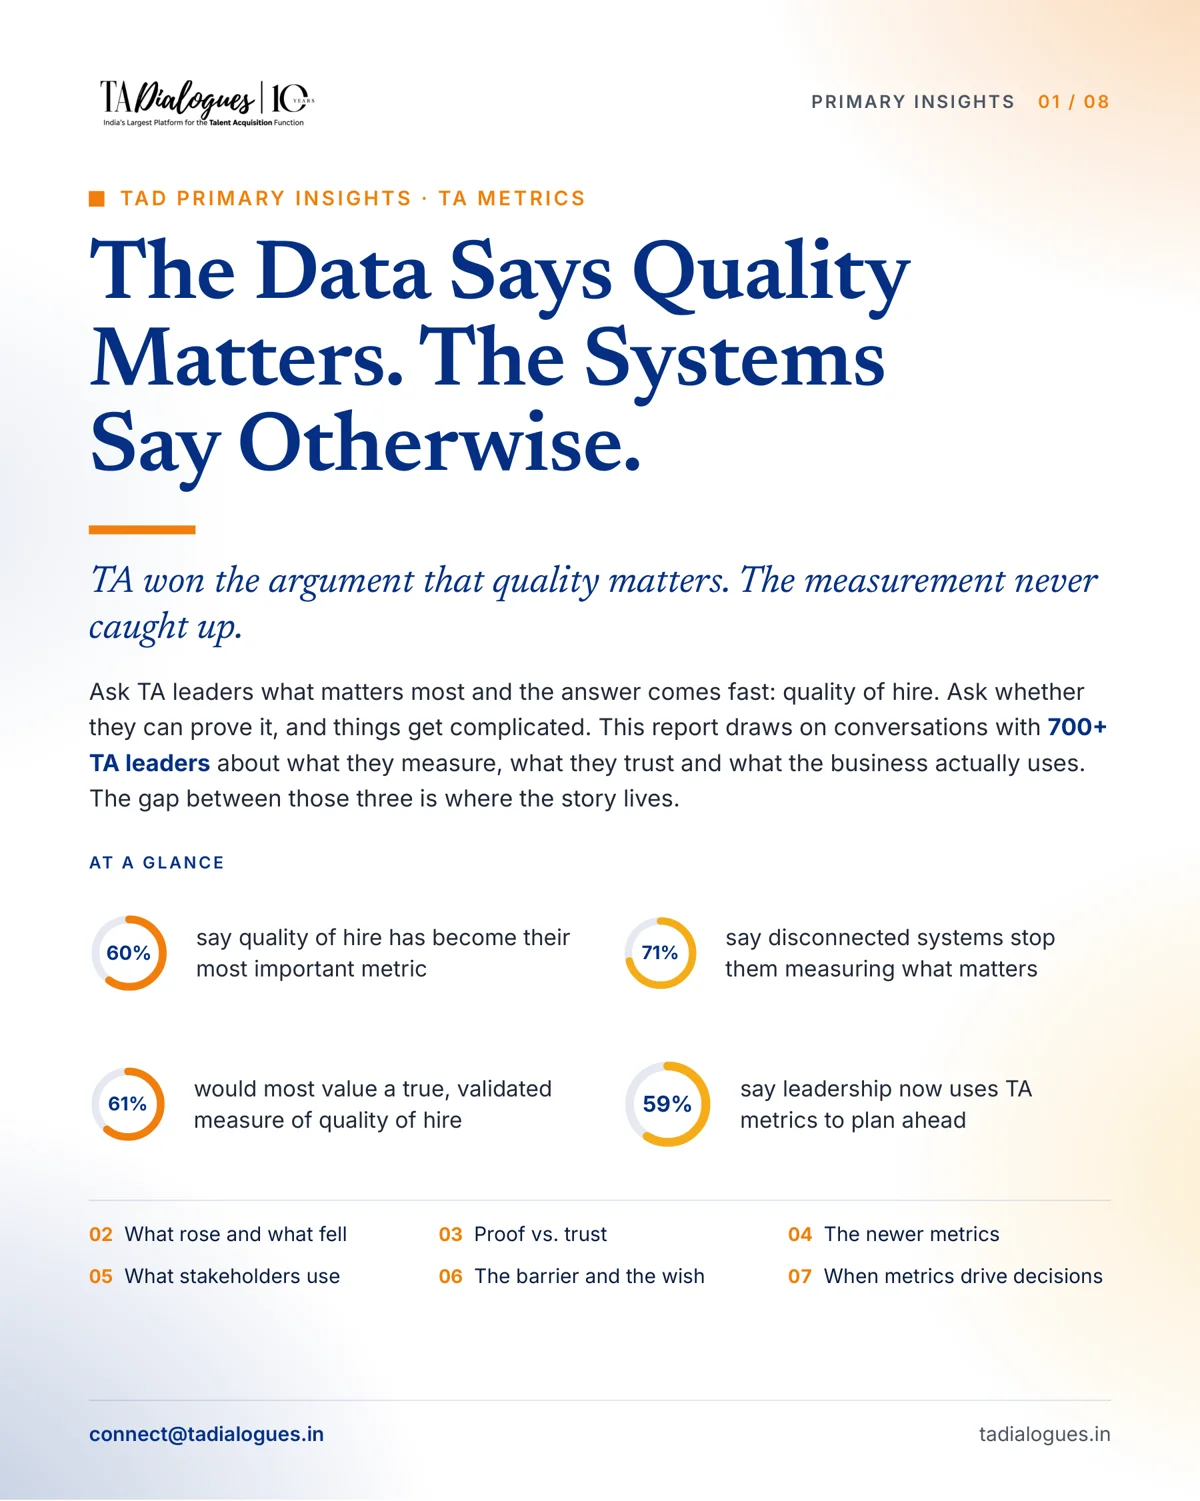
At a glance
60%say quality of hire has become their most important metric
71%say disconnected systems stop them measuring what matters
61%would most value a true, validated measure of quality of hire
59%say leadership now uses TA metrics to plan ahead
Inside the report
One finding per chapter, and what to do about it.
- 02
What rose and what fell
Quality of hire won by four to one. Almost nothing was dropped to make room.
We asked: Which one metric has become most important to your organization over the past 2–3 years?
What to do. When a new metric earns its place, retire an old one. A short list that everyone uses beats a long one that nobody reads.
- 03
Proof vs. trust
The two metrics leaders rely on most are the two they trust least.
We asked: If you could keep only one metric to prove TA’s business impact, which would it be?
What to do. Before presenting a metric to the business, fix how it’s counted. One agreed definition of time-to-fill and quality of hire does more for credibility than any new dashboard.
- 04
The newer metrics
The newest metric on the dashboard isn’t about hiring from outside at all.
We asked: Which newer metric (beyond traditional time/cost/quality) are you now tracking?
What to do. If internal mobility is on the dashboard, make sure TA owns part of that story: internal candidates on every shortlist, and a clear view of who is ready to move.
- 05
What stakeholders actually use
Two metrics drive most hiring decisions. The rest are reported into silence.
We asked: Which metrics do your business stakeholders (executives, hiring managers) actually use to make hiring decisions?
What to do. Split your reporting in two: a short business view built on quality and speed, and a fuller operating view for the TA team. Each audience gets what it actually uses.
- 06
The barrier and the wish
Leaders know what they want to measure. Their systems won’t let them.
We asked: What’s the single biggest challenge preventing you from measuring the metrics that matter most?
What to do. Start with one connection: link hiring data to performance data for a single role family. A small bridge that works makes the case for a bigger one.
- 07
When metrics drive decisions
Most leaders use metrics to plan ahead. For nearly one in four, it depends who’s asking.
We asked: When do TA metrics actually influence decisions or strategy in your organization?
What to do. Give TA metrics a fixed place in the business calendar, such as a standing slot in the monthly review, so they get looked at whoever is in the room.
- 08
Conclusion
The fix isn’t more metrics. It’s fewer, connected and believed.
The bottom line. TA has already won the argument that quality matters. The next step is to make the numbers as strong as the conviction behind them.
Read every chart in the full report.
8 pages, free. Just tell us where to reach you.
The TAD Times newsletter
Hiring trends, leadership perspectives and what's next on the calendar, straight to your inbox.
Read the latest edition on LinkedIn